
We are committed to stronger communication through data content and stronger connections through static and dynamic visuals + physical installation design to engage audiences no matter the medium.
Stories are more memorable when they are beautiful. When they make a statement and make you feel. You share stories that asked you to engage, to discover, and those that made you a character in the story.
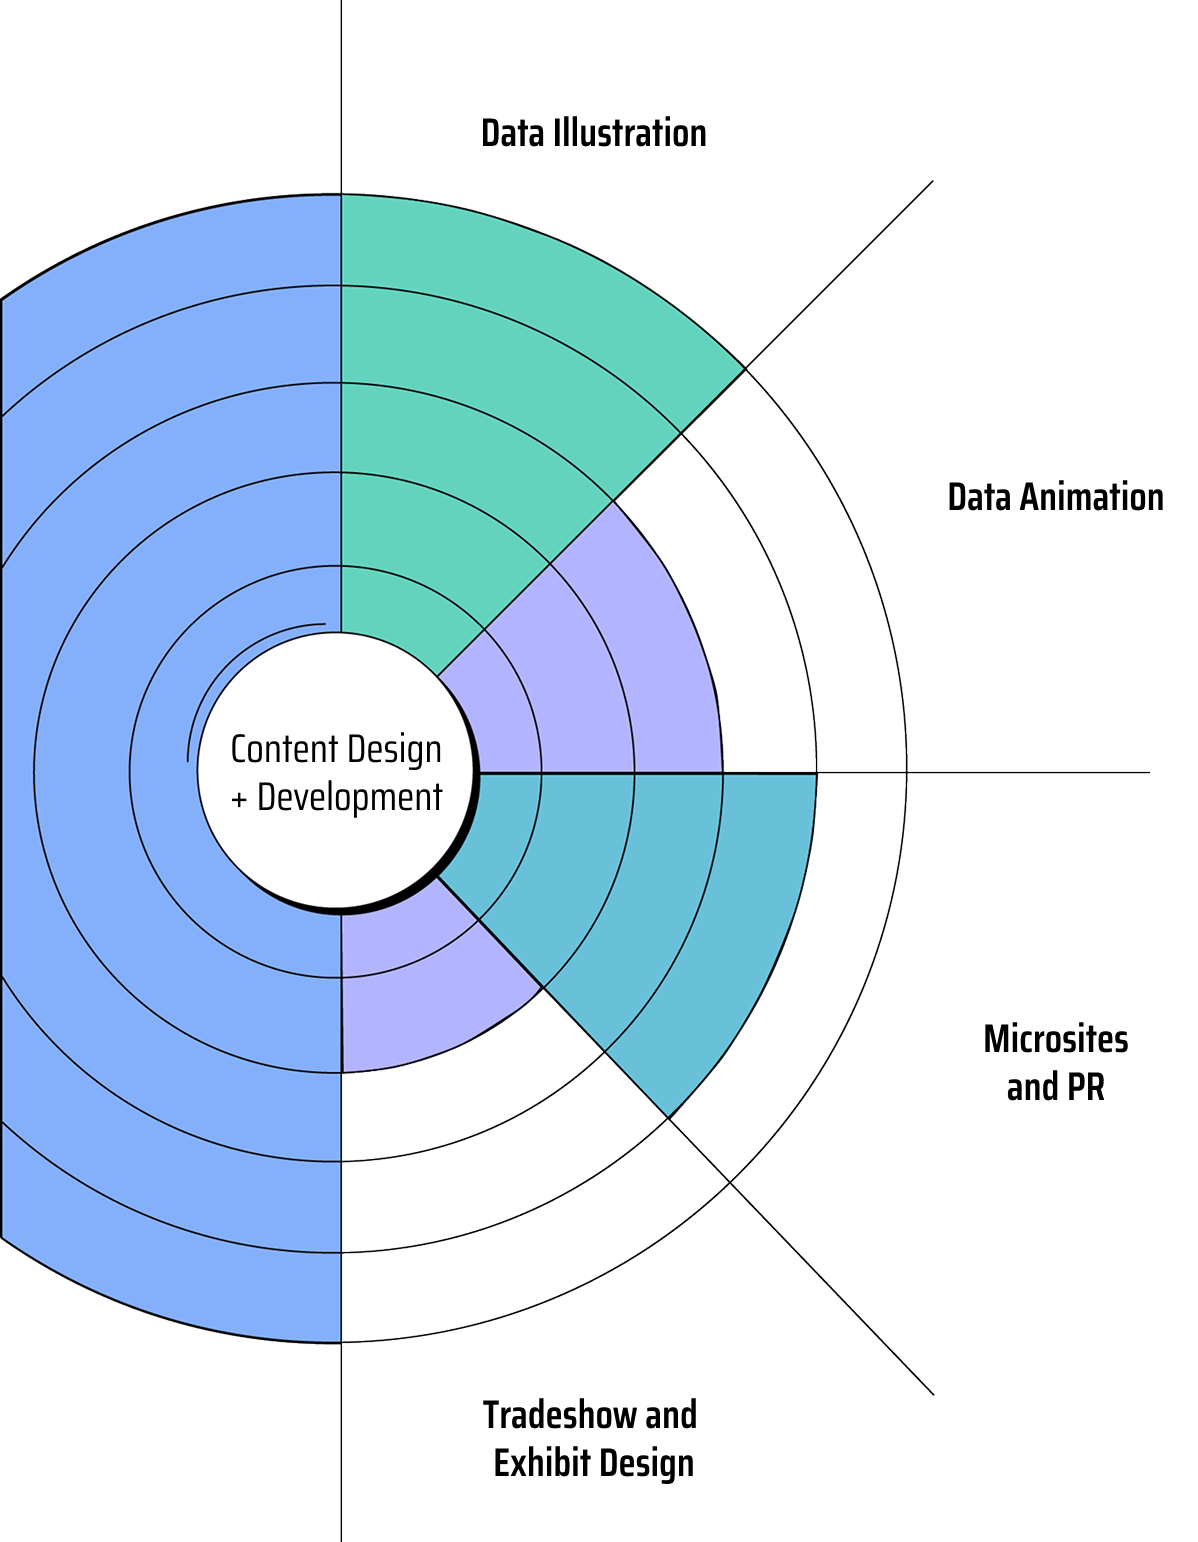
Data illustration and data animation infuse your charts and statistics with clarity, purpose, and creativity. Expert illustration ensures higher data literacy through clear annotation, strategic story points, and key takeaways - going beyond the basic graphs of Excel and PowerPoint. Animation layers on engagement making your story truly memorable.
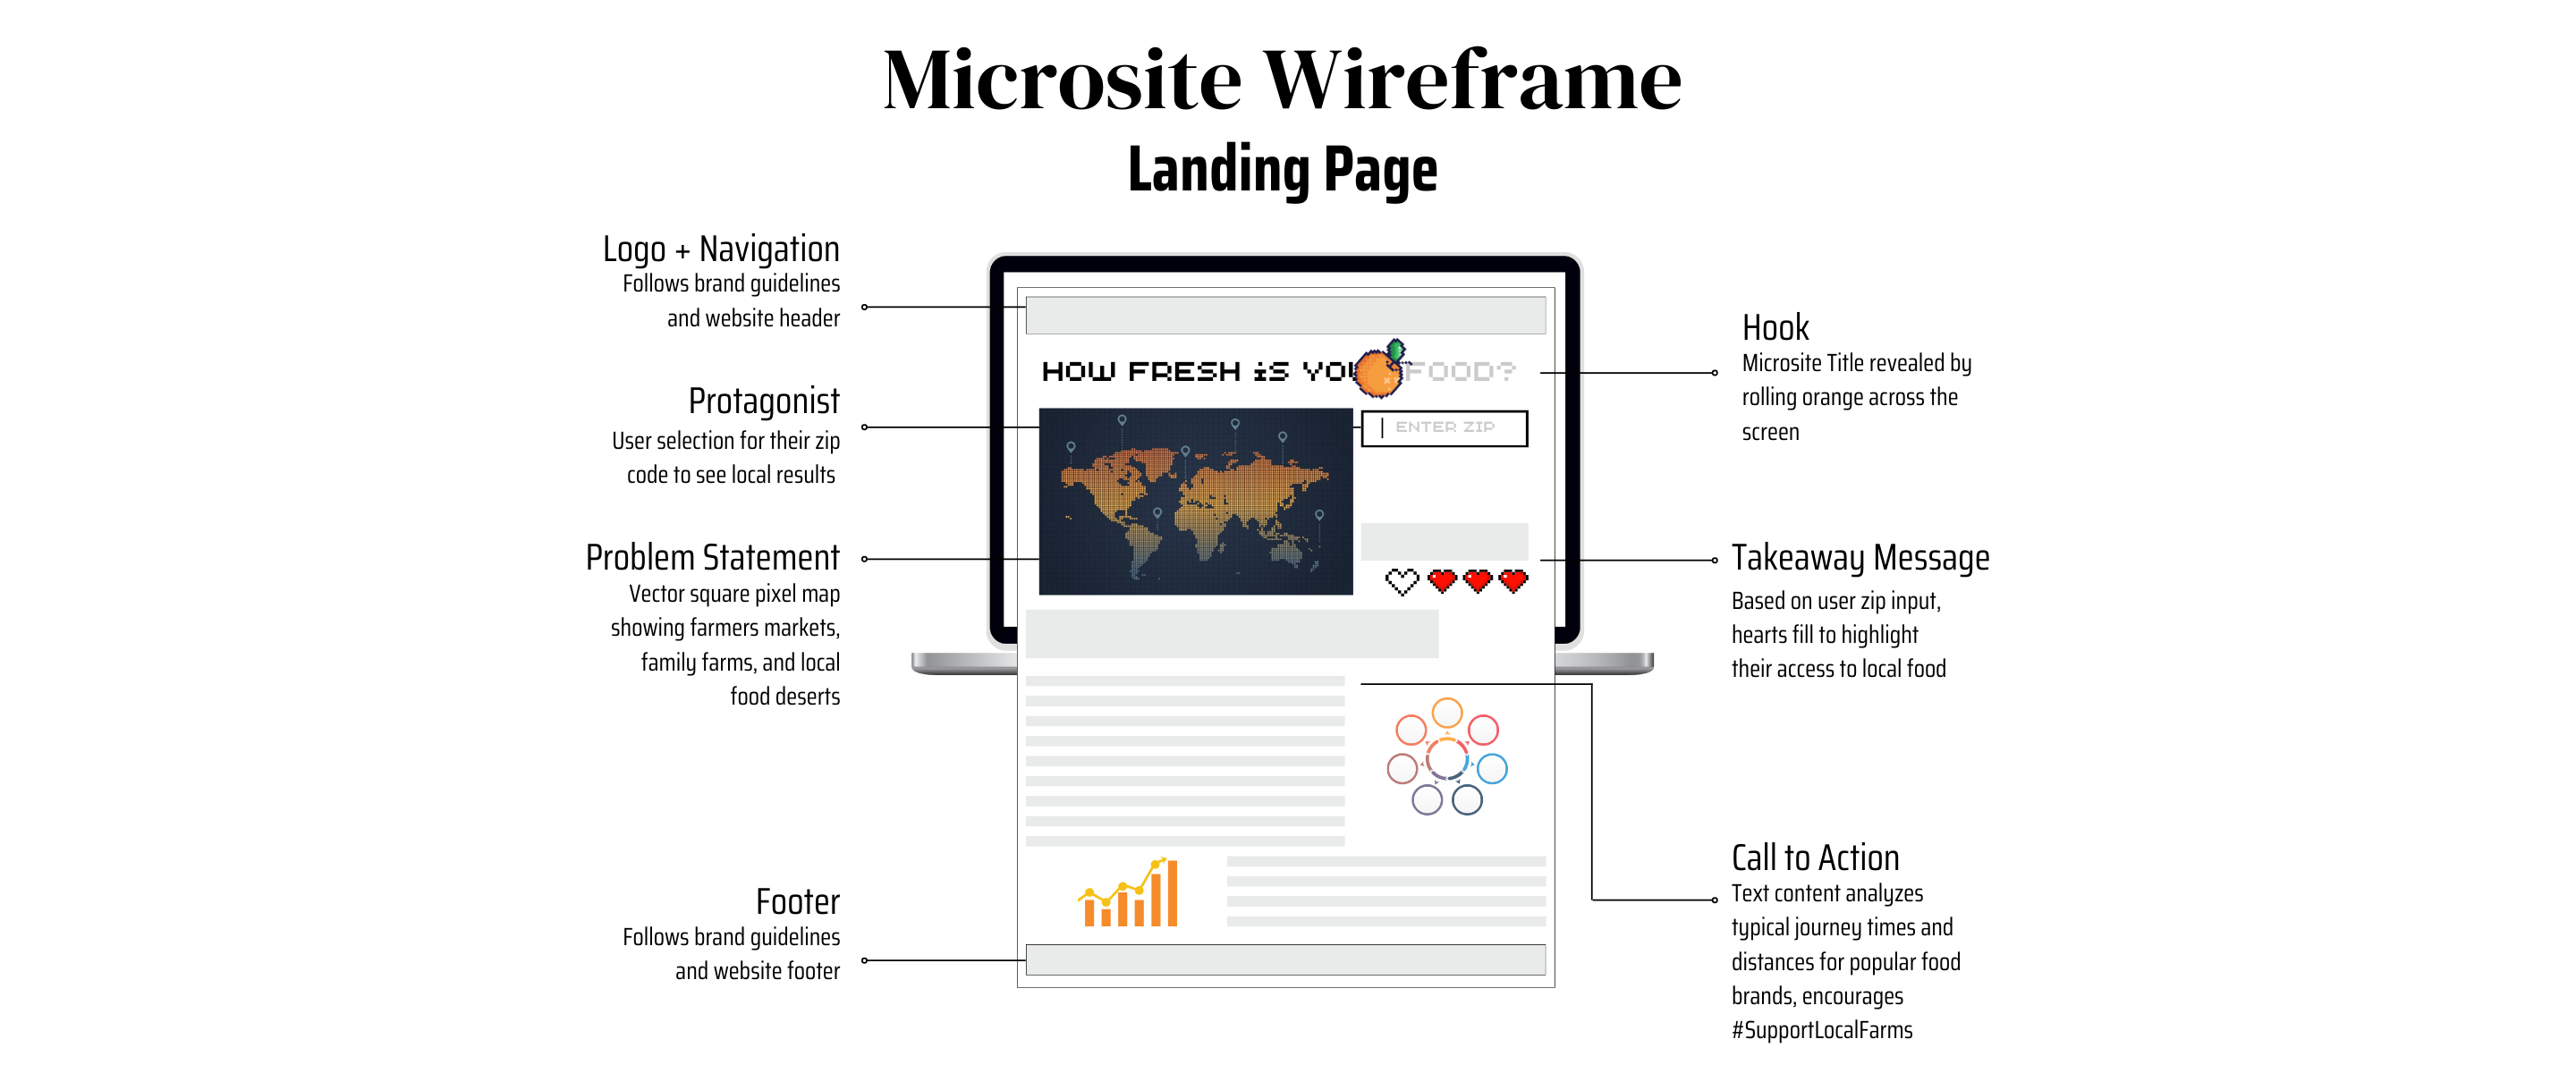
Microsites set your PR pitches apart from the competition. Adhering to web accessibility standards, and creating captivating content and interactive modules, we encourage your audiences to dive deeper and take action.
Have you ever considered a garden that communicates mental health statistics through plantings? What about a tradeshow booth that showcases live visitor data across the entire convention center? Our team is skilled in exhibit design and user engagement bringing your data story to life with exhibit and tradeshow booth design.
To be continued in your story...
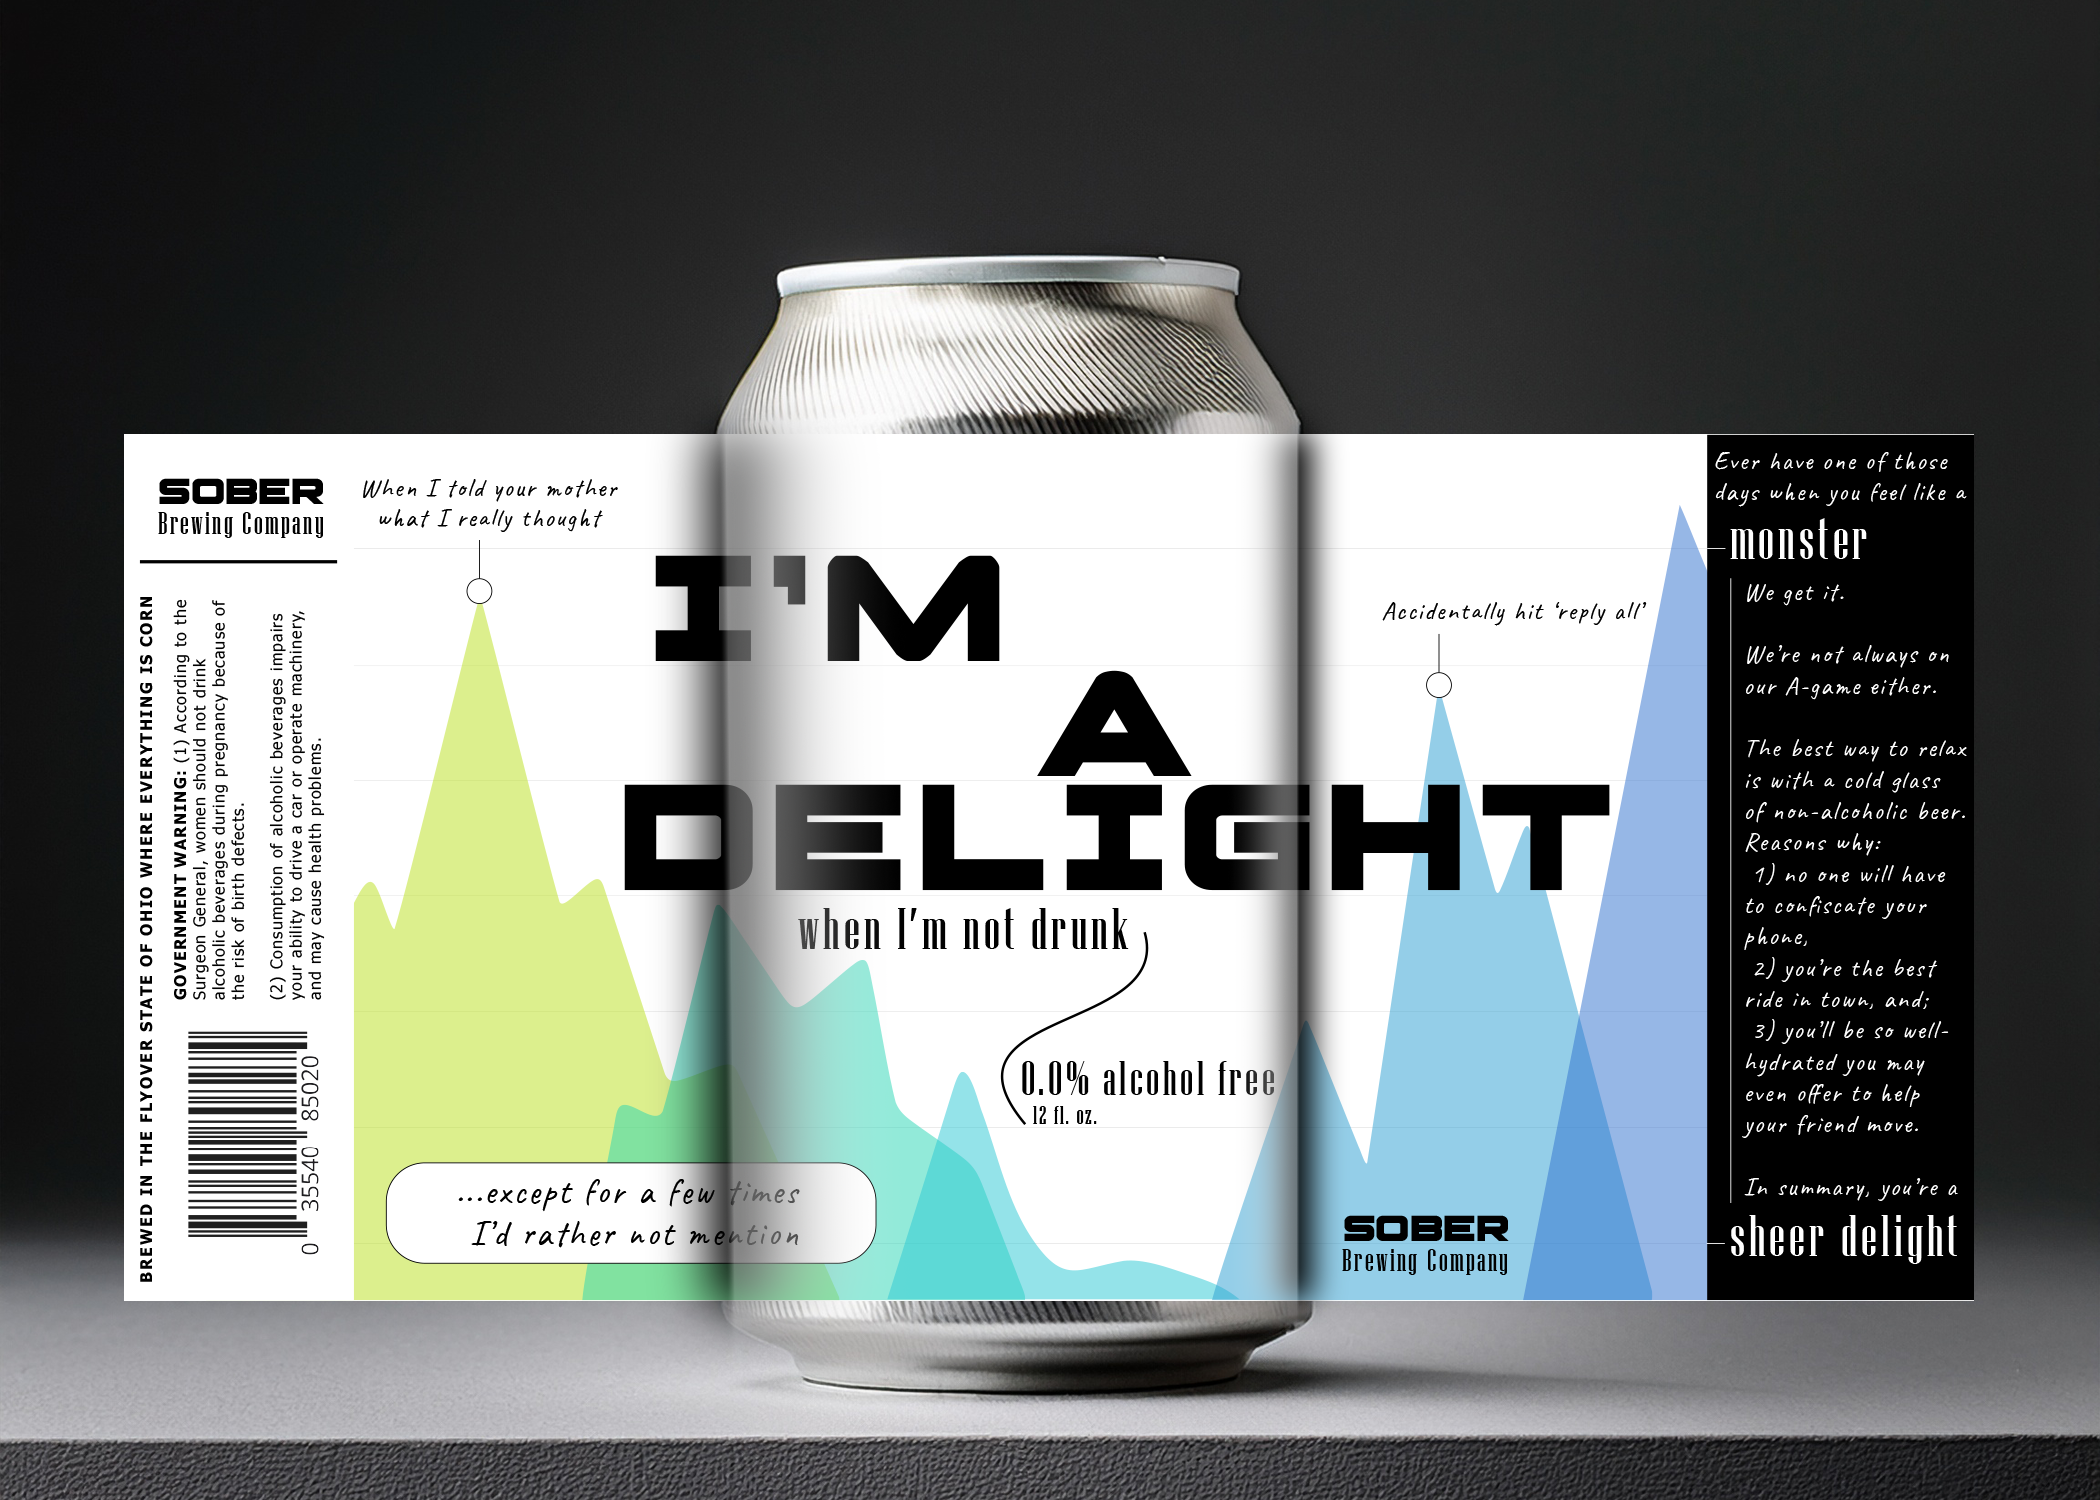
Product Design
Social Media Post
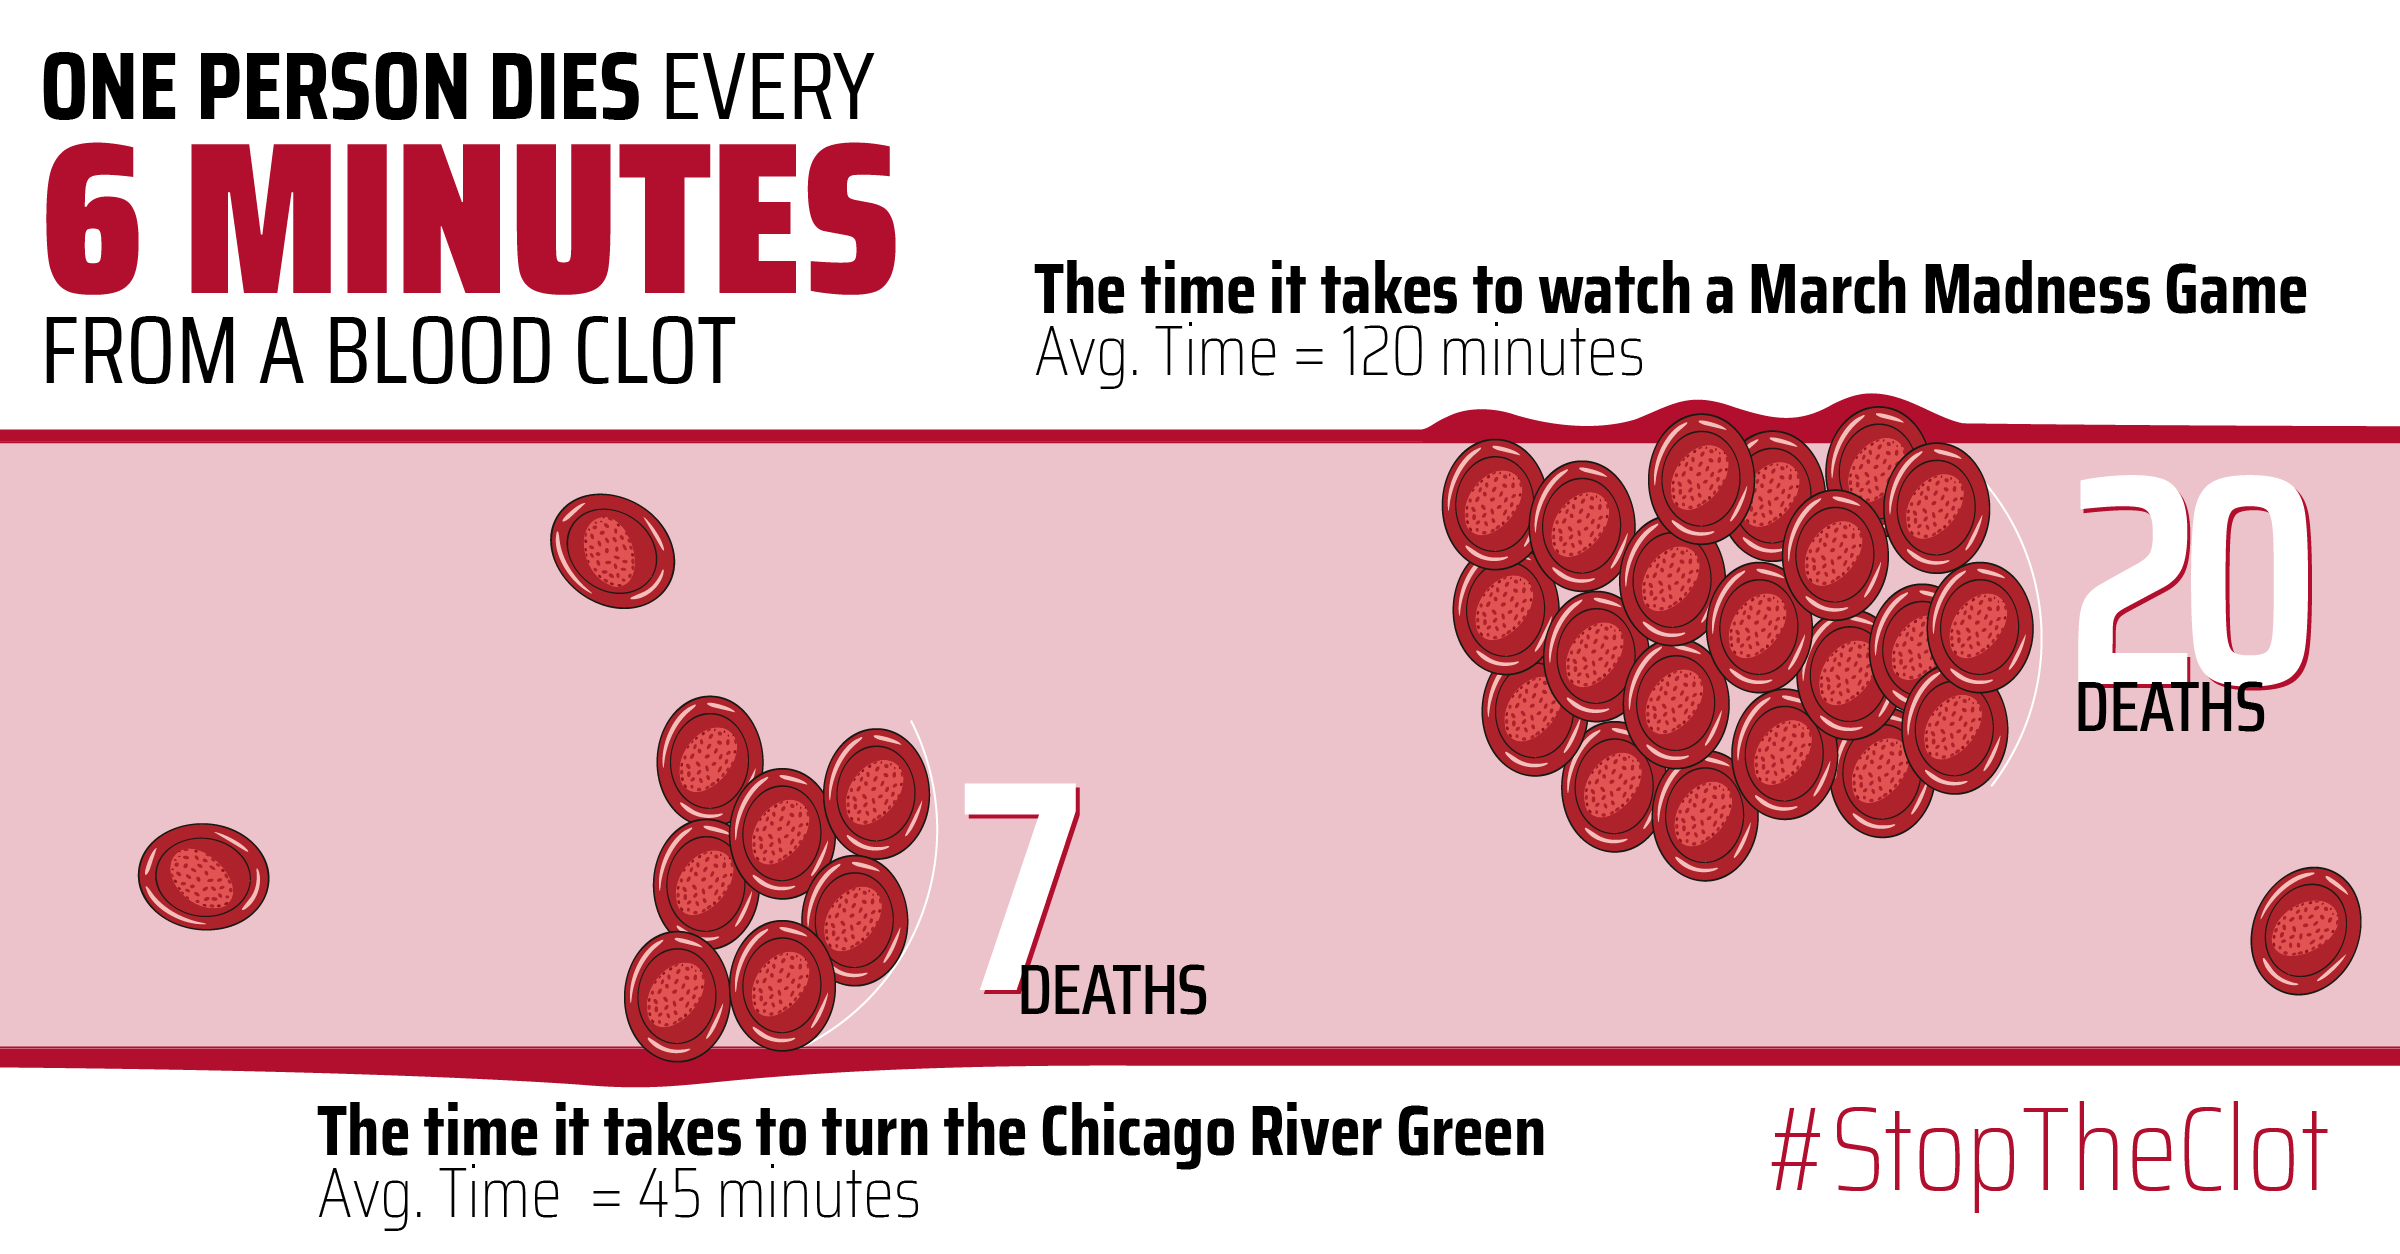
Custom Visualization
Because your social team is using Canva, your accountants are using Excel, and your CEO just used a dual axis with zero labels. Need we say more?
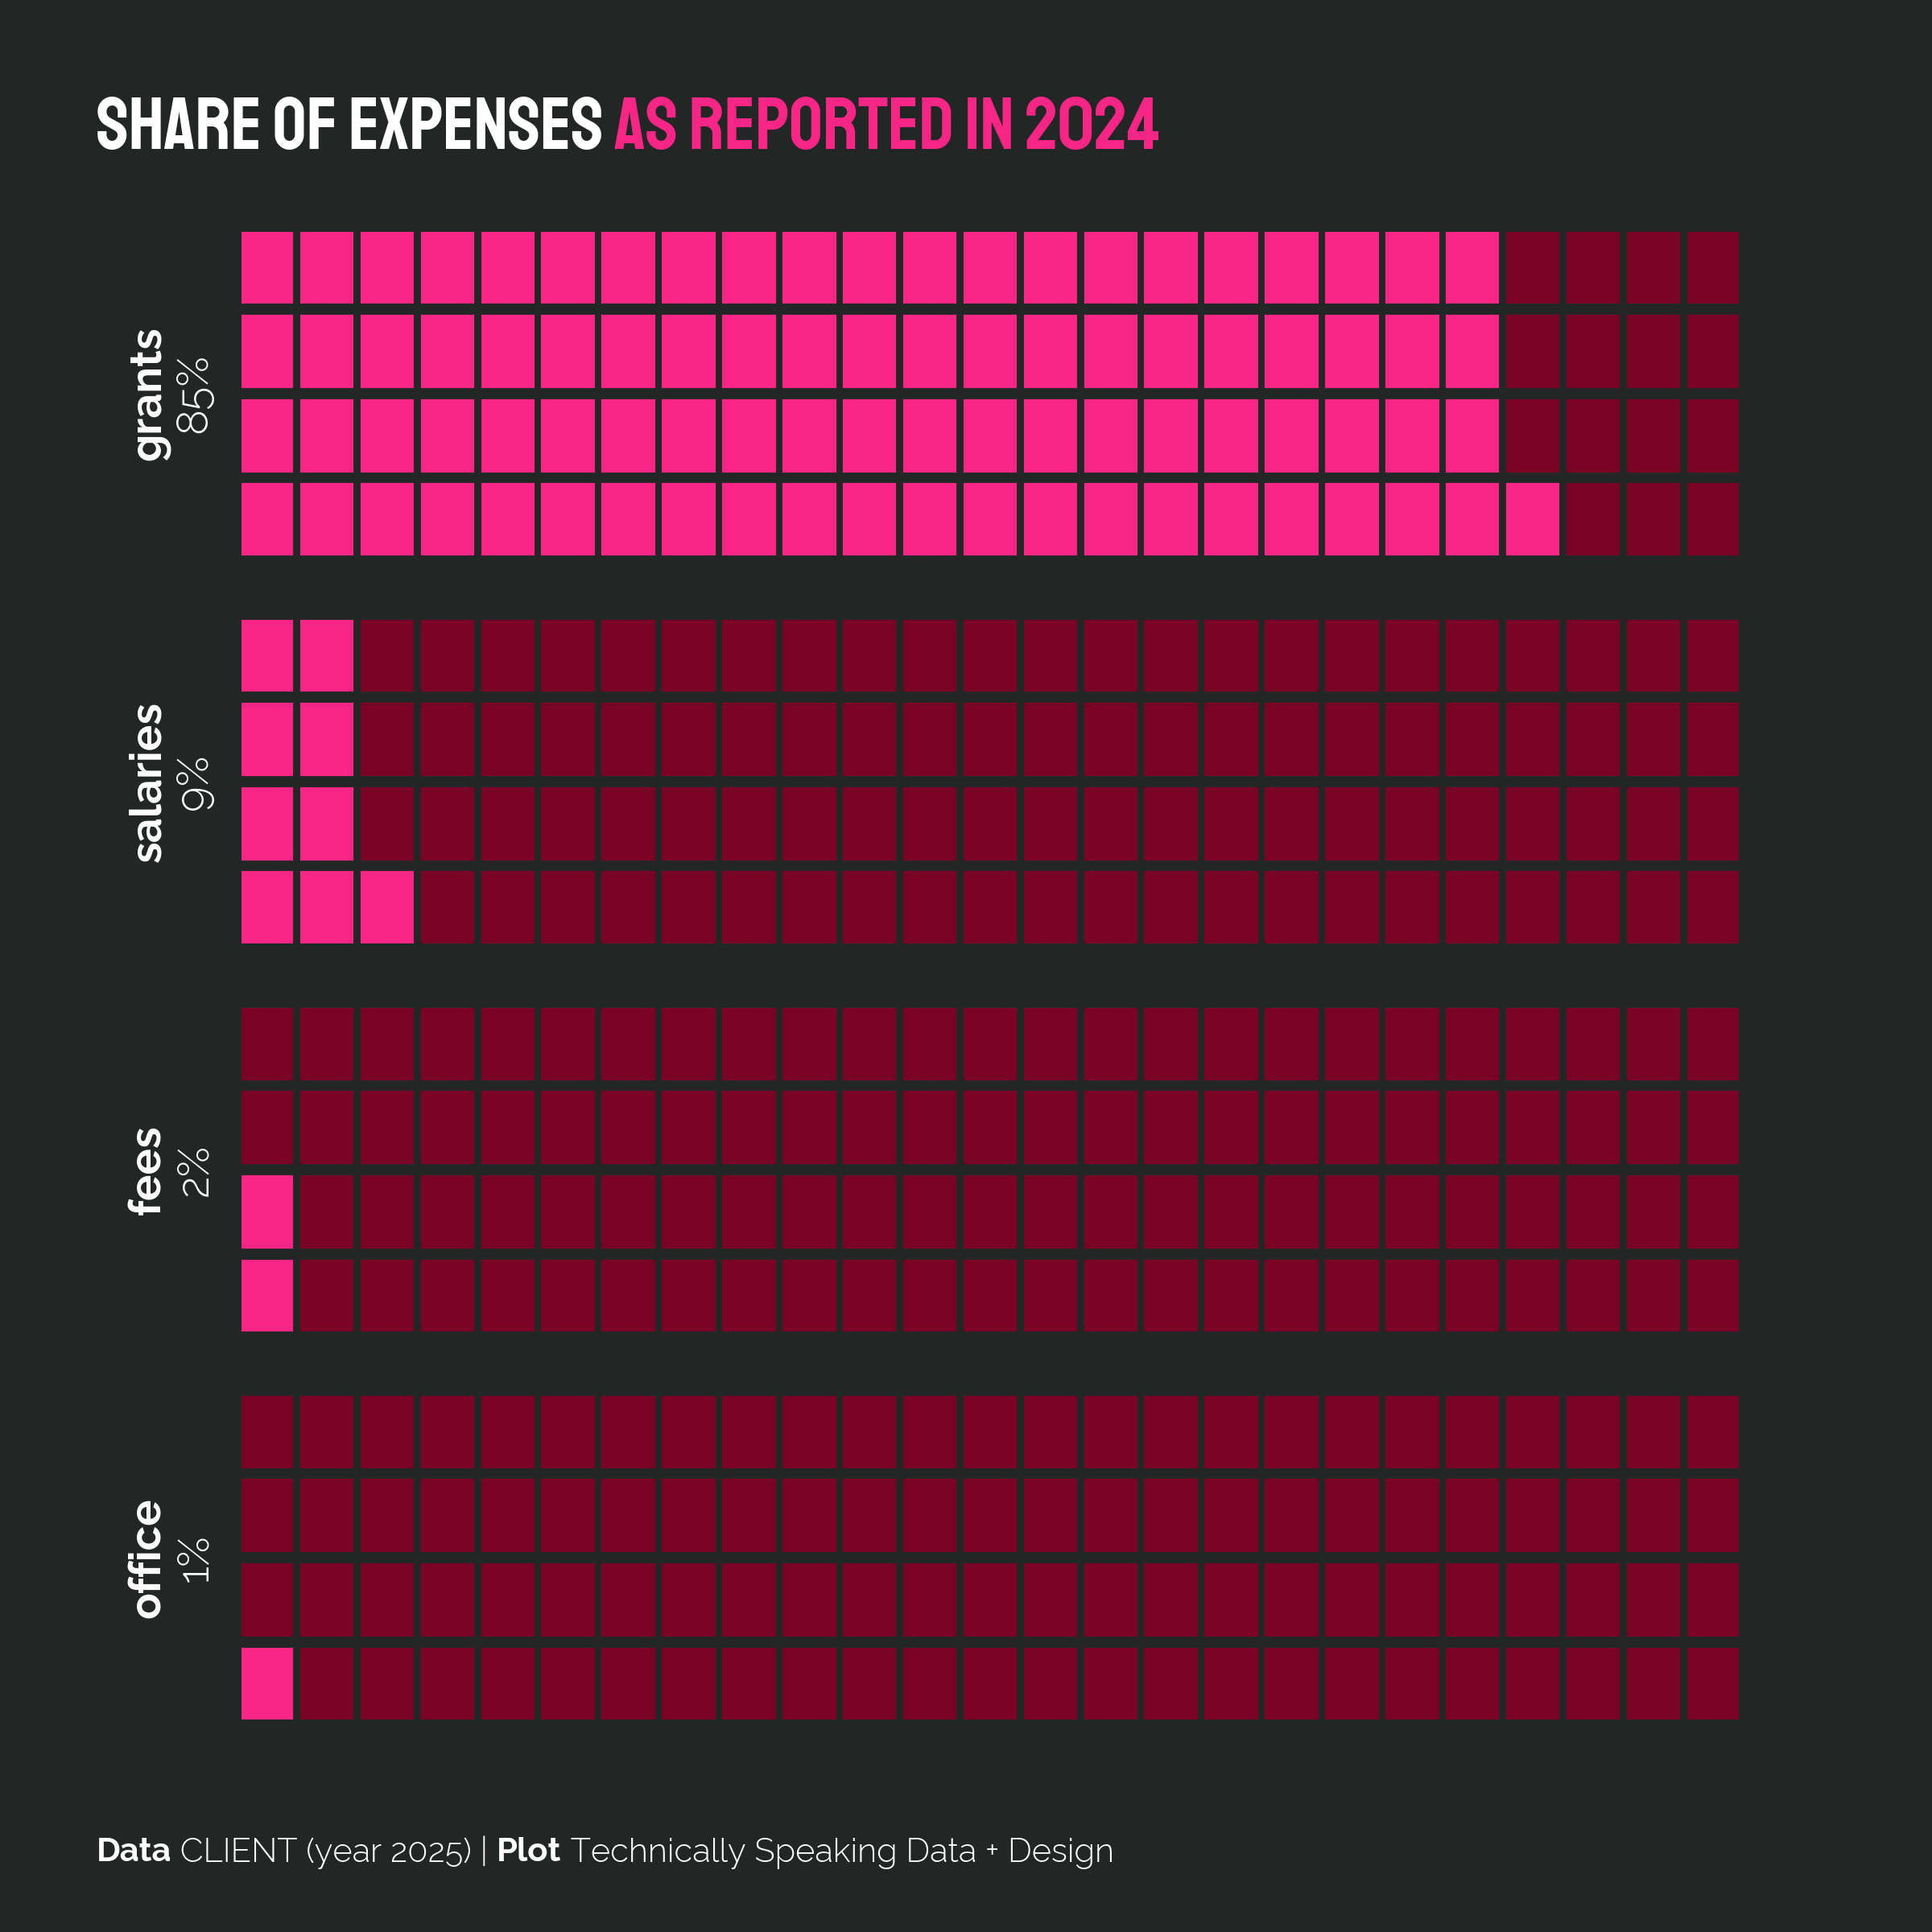
Read MoreProblem Statement: Despite ongoing discussions about gender disparity in tech, the software developer gender gap remains a pressing issue underscoring the need for impactful communication to drive awareness and action.
Solution: We developed a series of visually cohesive and compelling data visualizations within a brand strategy, enabling their use not only in an annual report but also across various social and digital platforms to amplify their reach and engagement. Create your own data visualization guidelines.
Results: A central image served as a striking focal point, combining beauty and memorability to leave a lasting impression. Complementary graphs provided layered insights, enriching the narrative and inviting deeper exploration of the data.
.png)
Dream client statement.
Problem Statement: Traditional PR pitches often lack depth and visual interactivity, making it challenging for digital content editors to fully engage with the material or independently explore its nuances. This creates barriers to fostering data democracy and self-discovery.
Solution: We transform the PR pitch into a dynamic microsite, blending responsive web design with engaging interactive elements. Key features include data visualizations tailored for digital storytelling, an intuitive layout enabling seamless self-navigation, and tools empowering content editors to adapt insights into their unique digital contexts. Create your own PR microsite pitch.
Results: By enabling self-discovery through intuitive design and data democracy, the microsite not only amplifies the PR pitch's reach but also enriches its impact across diverse digital platforms. Not to mention that your editor will love you for the annotated code and suggested web design.